Valuation of freshwater ecosystems
Everyone is interested in return on their investment. The benefits of source water protection extend beyond public health protection and better drinking water quality. These benefits, which are mutual, cumulative, and synergistic, include:
- Lower treatment costs through upstream ecosystem restoration and water-centric land use
- Increased water awareness, collaboration, and environmental stewardship
- Improved data collection and sharing to support decision-makers
- Improved emergency preparedness and response
- Healthier, more resilient watersheds through the protection of habitat and ecosystem services
- Increased property value through multi-purposed urban beautification measures.
Divorcing the cost of water treatment from resource extraction sectors results in no accounting for the extra costs incurred by the water purveyor due to watershed activities. True cost accounting must compare the revenue streams from watershed activities against the ecosystem services that naturally protect drinking water. As part of this cost accounting, ecosystem services valuation assigns a monetary value to ecological services, such as filtration, biochemical contaminant removal, water temperature stabilization, and flow modulation, to be set against the cost of protecting the core areas of these resources.
But how much is a watershed worth?
As an example, according to Parrott and Kyle 2014 the total monetary value of ecosystem services provided by the Okanagan landscape likely exceeds $6.7 billion annually (in 2007 international dollars[1]). The total value of $6.7 billion/year for the Okanagan likely represents a minimum rather than a maximum value because some services have non-monetary values that are difficult to quantify. These services include aesthetics, First Nation cultural values, value of habitats that support rare or endangered species and these are not accounted for in the calculation due to the difficulty of attaching a monetary value to them. Table 20 provides some of the economic components that are factored in this type of analysis. An update of this table would be an asset to Okanagan source water protection.
[1] The international dollar is a hypothetical unit of currency that has the same purchasing power parity that the U.S. dollar had in the United States at a given point in time.
Table 20: Land cover areas in the Okanagan and values of ecosystem service flows
| Land Cover | Area (hectares) | Unit Value (2007$/ha/yr) * | Total Value (2007$/yr) |
| Crops | 7820 | $ 5,567 | $ 43,535,610 |
| Pasture | 15520 | $ 4,166 | $ 64,654,904 |
| Water | 64108 | $ 12,512 | $ 802,121,298 |
| Wetlands | 12219 | $ 25,681 | $ 313,792,030 |
| Forest | 1629744 | $ 3,137 | $ 5,122,507,587 |
| Grasslands | 90626 | $ 4,166 | $ 377,549,249 |
| Total | $ 6,714,160,678 |
Putting a value on ecological services is difficult but do-able. The preceding table is an initial estimate based on land valuations elsewhere. To tune this estimate to Okanagan realities, Dr. John Janmaat, Associate Professor of Economics at the University of British Columbia, suggested the following:
Some of these land values may be underestimates, and for others, overestimates. For those types that are scarce, such as valley bottom natural grasslands and wetlands, the per hectare values used by Parrott and Kyle may be too low. These are landscapes that rare and endangered species in our valley rely on, and there is no substitute. These landscapes also provide substantial aesthetic, recreational, and cultural values. In comparison, forested areas that are far from a waterbody and not critical habitat may not have much value beyond carbon storage and primary production of trees, or of game species that could be harvested. Unfortunately, without spatial mapping of the ecological services provided across the landscape, we can’t do much better than applying averages to what we do know, which is land cover types.
A freshwater ecosystem analysis should:
- Start with identifying the ecosystem services of interest and frame the major effects of multiple drivers and pressures on the ecological status of waterbodies.
- Involve a biophysical quantification of the natural capacity, actual flow, and social benefit of water ecosystem services, and can use proxies/indicators based mainly on hydrological models or data.
- Assess a sustainability (or efficiency) index that estimates the flow of service that can be sustained with a certain capacity to avoid overexploitation.
This is a large undertaking that could be spearheaded by UBCO and/or OBWB, with support from water purveyors, municipalities First Nations and their TACs. An Okanagan-wide TAC has been broadly advocated for, and could be instrumental here.
Quantifying the benefits of ecosystem services that nature provides would help justify the investments in conservation and restoration of aquatic systems. Stakeholders can have different values and perspectives. Therefore, similar to the entire source water protection effort, involving all stakeholders in the valuation process is vital. This exercise can highlight hidden benefits for society and raise awareness among users and stakeholders.
The definitions of value should not be restricted to monetary value but embrace sociocultural and ecological values as well. The co-benefits of these less-tangible values and nature-based solutions should be accounted for in ecosystem services valuation. For example, protection of less-tangible aesthetic/social/spiritual values can still cause economic impact such as mental health/addiction treatment costs.
Economic valuation of aquatic ecosystems can be used for assessing the benefits of conservation and restoration. It can integrate all the economic, environmental, and social benefits and losses associated with resource extraction and development and with new water plans and investments. Several mathematical methods are available in the literature to estimate economic values of freshwater ecosystem services: Koundouri et al. 2015; Grizzetti et al. 2016; Costanza et al. 2014; Kennedy and Wilson 2009.
The approaches can be divided into: 1) cost-based approaches that consider the costs from the provision of services; and 2) preference-based approaches that refer to techniques using data on individual preferences for a marketable good, which includes environmental attributes and preferences for non-market environmental goods. Table 21 provides B.C. examples of aquatic ecosystem valuation approaches and methods.
Table 21: Aquatic ecosystem valuation approaches and methods – B.C. examples
COST-BASED APPROACHES
Valuation method
Description / Spatial scale
Use it to evaluate:
Avoided Cost:
Estimates the value of an ecological service and the cost avoided by preserving that service. Example: protection of key watershed areas for flood control.
Flood control, erosion protection, pest and disease control, soils protection/formation
Replacement Cost:
Estimates the value of an ecological services and the cost of projects or programs that would be needed to replace it. Example: watershed or urban region nutrient uptake and cycling can only be replaced with costly treatment plants.
Fish populations, fishing/hunting, wildlife habitats, water purification, air quality regulation, flood protection, erosion prevention, resource extraction in riparian zones
Cost-Benefit Analysis:
Compares the benefits of ecosystem uses and extractions with the costs to society and government; use market pricing and asset production. Example: logging watershed impacts versus impacts of altered hydrograph.
Logging, mining, micro-hydro generation
Net Factor Income:
Ecological services can enhance incomes. Example: watershed-wide water quality improvements decrease treatment costs and maintain fisheries and aesthetic values for recreational incomes.
Water treatment, fisheries, recreational use, parks, aesthetics, tourism-based businesses
PREFERENCE-BASED APPROACHES
Valuation method
Description / Spatial scale
Use it to evaluate:
Travel Cost:
Estimates the value of a service by calculating the time and money spent by individuals travelling to enjoy or experience the service. Example: travel to enjoy B.C. lakes and backcountry.
Recreation, spiritual and symbolic appreciation, intellectual and aesthetic appreciation, parks and reserves
Hedonic Pricing:
Estimates the value of an ecological service by comparing property values of multiple properties controlling for other factors, to determine the impact of that service on property value. Example: local housing prices along the lakeshore exceed the prices at other locations.
Recreation, real estate
Contingent Valuation:
Estimates the value of a service with surveys that ask respondents how much they would be willing to pay to protect an ecological service, or how much they would be willing to pay to forego a service using a valuation of land-use alternatives. Example: This method is often used for less tangible services such as shoreline biodiversity or wildlife habitat.
Wildlife habitat, shoreline habitat, carbon sequestration
Adapted from Wilson 2008, Kennedy and Wilson 2009 (refer to Appendix 6 of that report for more ecosystem valuation), and Grizzetti et al. 2016
Pro Tip: A practical way to value ecosystem services when data and/or funds are limited is the benefit transfer approach, where the benefit estimated for one area or policy is adapted and used to assign benefit or value to other comparable situations.
In summary, the economics of source water protection pay significant dividends to all stakeholders and they are additive – more investment yields better cumulative benefits. The economics of foregoing source water protection are clear – the cumulative liabilities of illness, costs of remediation, and costs of water treatment. We all need to invest in water protection.
Comparison of water treatment costs to source water protection costs
The trade-off between source water protection and water treatment should guide strategic investments in natural infrastructure or pollution reduction in the watershed rather than paying for more expensive water treatment. The problem is, we don’t know where those trade-offs balance.
Researchers today can quantify the obvious: the benefits of forest cover directly impact the cost of water treatment. Using American Water Works Association (AWWA) data from 37 US water treatment plants to determine the effect of forest conversion on the cost of water treatment found a negative relationship between forest cover and turbidity, but no relationship between forest cover and total organic carbon (Warziniack et al. 2017). Increasing forest cover in a watershed by 1% reduces turbidity by 3%, and conversely, increasing development by 1% in a watershed increases turbidity by 3%. The impact of development was more consistent across their models than the impact of forest cover. They also found a large impact on turbidity from grazing in the watershed.
Looking only at turbidity treatment costs and no other impacts of watershed disturbance, an economic benefits function showed that a 1% increase in turbidity increases water treatment costs by 0.19%, and a 1% increase in total organic carbon increases water treatment costs by 0.46%(Warziniack et al. 2017). Even marginal improvements in source water quality led to modest reductions in treatment costs. Recent US- and Canada-based studies indicate that a 1% decline in turbidity leads to a 0.09–0.11% reduction in variable costs (Price et al. 2017, Heberling et al. 2015). For example, with a $1 million annual treatment cost budget, a water supplier could save $3,300 per year if a 3% reduction in turbidity leads to a 0.11% reduction in treatment costs. These analyses could not factor in thresholds or disease vectors. For example, utilities with raw turbidity levels above 10 NTUs may exceed a threshold for water quality at which direct filtration methods are either not possible or not economical. Further, if supplies decline due to climate or watershed disturbance the cost of water treatment increases (Heberling et al. 2015, Renzetti 2001). Water supply reliability can force an even greater increase in treatment costs than water availability (Renzetti 2001). Watershed disturbance from logging, gravel extraction and especially urbanization causes greater fluctuations in flows and timing of flows, adding to the impact of variable precipitation. Studies have shown that when there is a 1% increase in the amount of land clearing in a watershed, the costs of water treatment can go up by 3% (Heberling et al. 2015, Renzetti 2001, AWWA 2016). In the Okanagan, some watersheds approach >50% disturbance so this metric predicts a 150% increase in water treatment costs.
Water treatment can be more economical than source water protection; however, water treatment plants are prone to failure (e.g., Walkerton 2000, First Nations Marten Falls 2005 and Serpent River 2009), and insidious contaminants from the watershed can resist treatment. Further, the waterbodies on which other resources rely can be damaged by degraded source water areas.
Besides variable costs, source water quality affects expenditures on capital equipment. McDonald et al. (2016), for instance, found a positive correlation between the amount of sediment and nutrients entering source watersheds and the probability of adopting more sophisticated treatment technology. In addition, there are numerous instances where deteriorating source water quality has been anecdotally linked to capital upgrades (Dunlap et al. 2015, Davenport and Drake 2011, Jones et al. 2007, Oneby and Bollyky 2006).
Valuation of riparian buffers
One of the most powerful ways to protect water quality is through recognizing, conserving, and enhancing buffer zones separating land activities from watercourses. This applies to all portions of a watershed, from the upland zones to urban areas, but the applications differ. Municipalities and water suppliers need to play a strong role in maintaining the natural filtration capacity of natural creek buffer zones upstream of water works.
Riparian buffer zones can:
- Stabilize eroding banks or shorelines of adjacent waterbodies
- Lower peak stormflows
- Improve water quality (i.e., lower contaminants, nutrients, sediment through bio-filtration in rhizospheres)
- Provide habitat
- Increase property values and aesthetic values
The functions performed by buffer zones and leave strips along watercourses and shorelines are a direct function of their width, vegetation, and condition. Figures 6, 7 and 8 can be used as a general guide to decide a target width to achieve your source water protection goals using buffer zones. Clearly, the wider, the better for source water, but identifying target areas and giving them greater protection makes sense. For example, buffer zones can safely be far smaller on remote seasonal streams compared to mainstem lakes near headgates. The value of intact riparian buffer is estimated at $7.50 CND/ha/yr per household (adapted from Rempel and Buckley 2018).
Figure 6: Comparison of filtration capacity of natural and disturbed shorelines
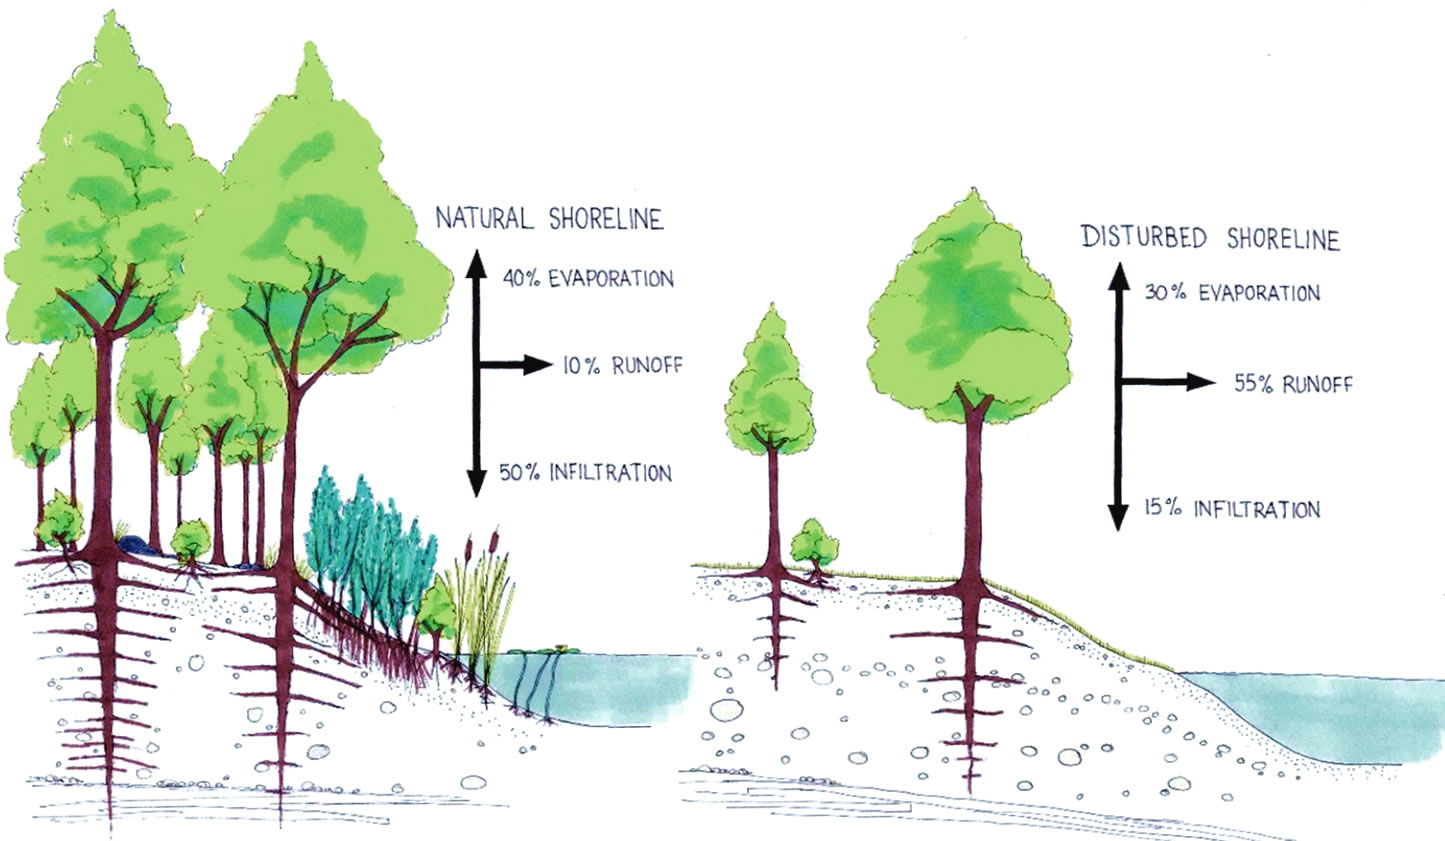
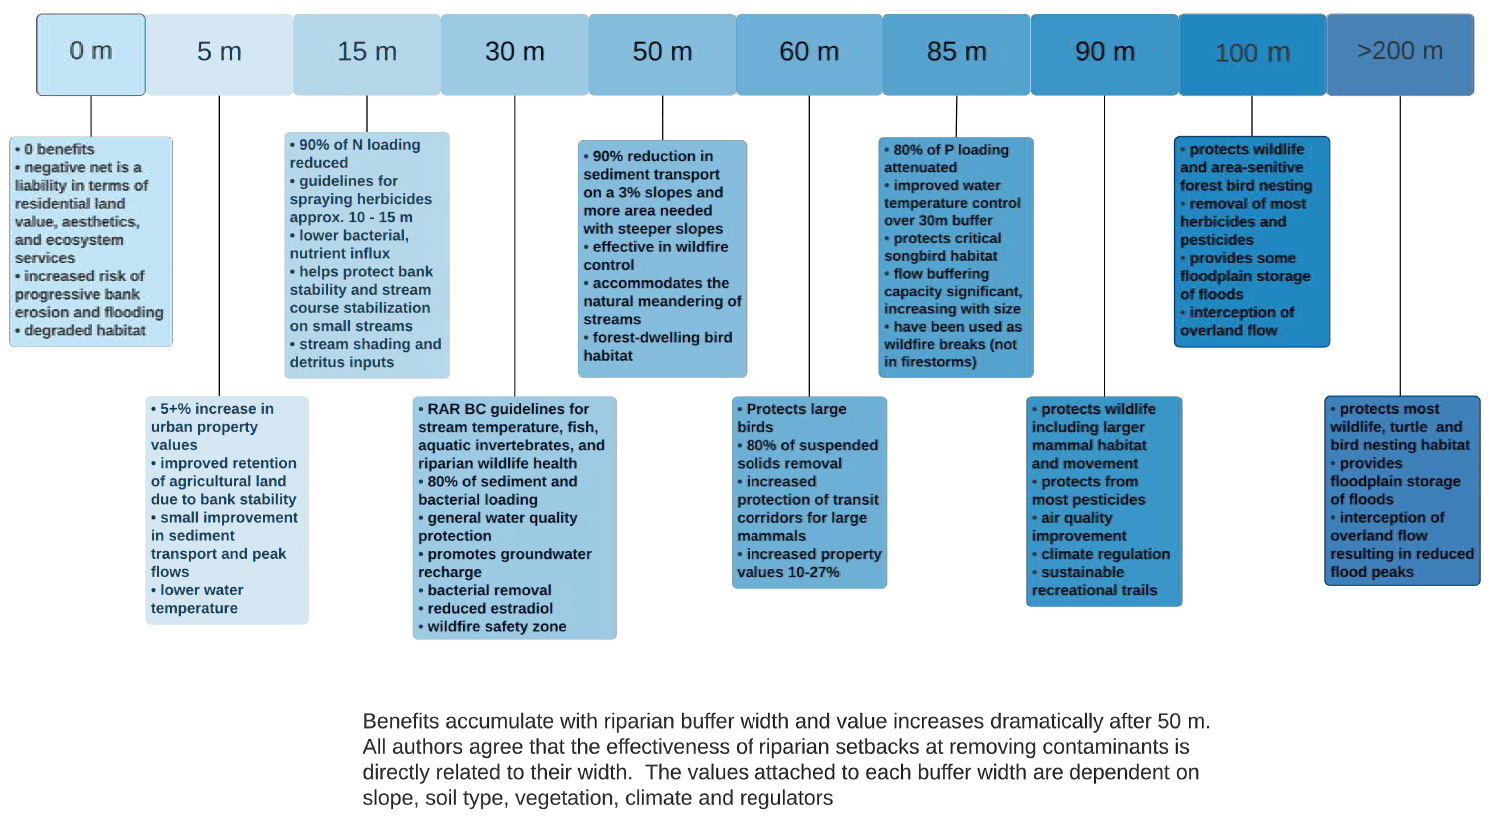
Figure 7: Services provided by varying widths of riparian buffer zones
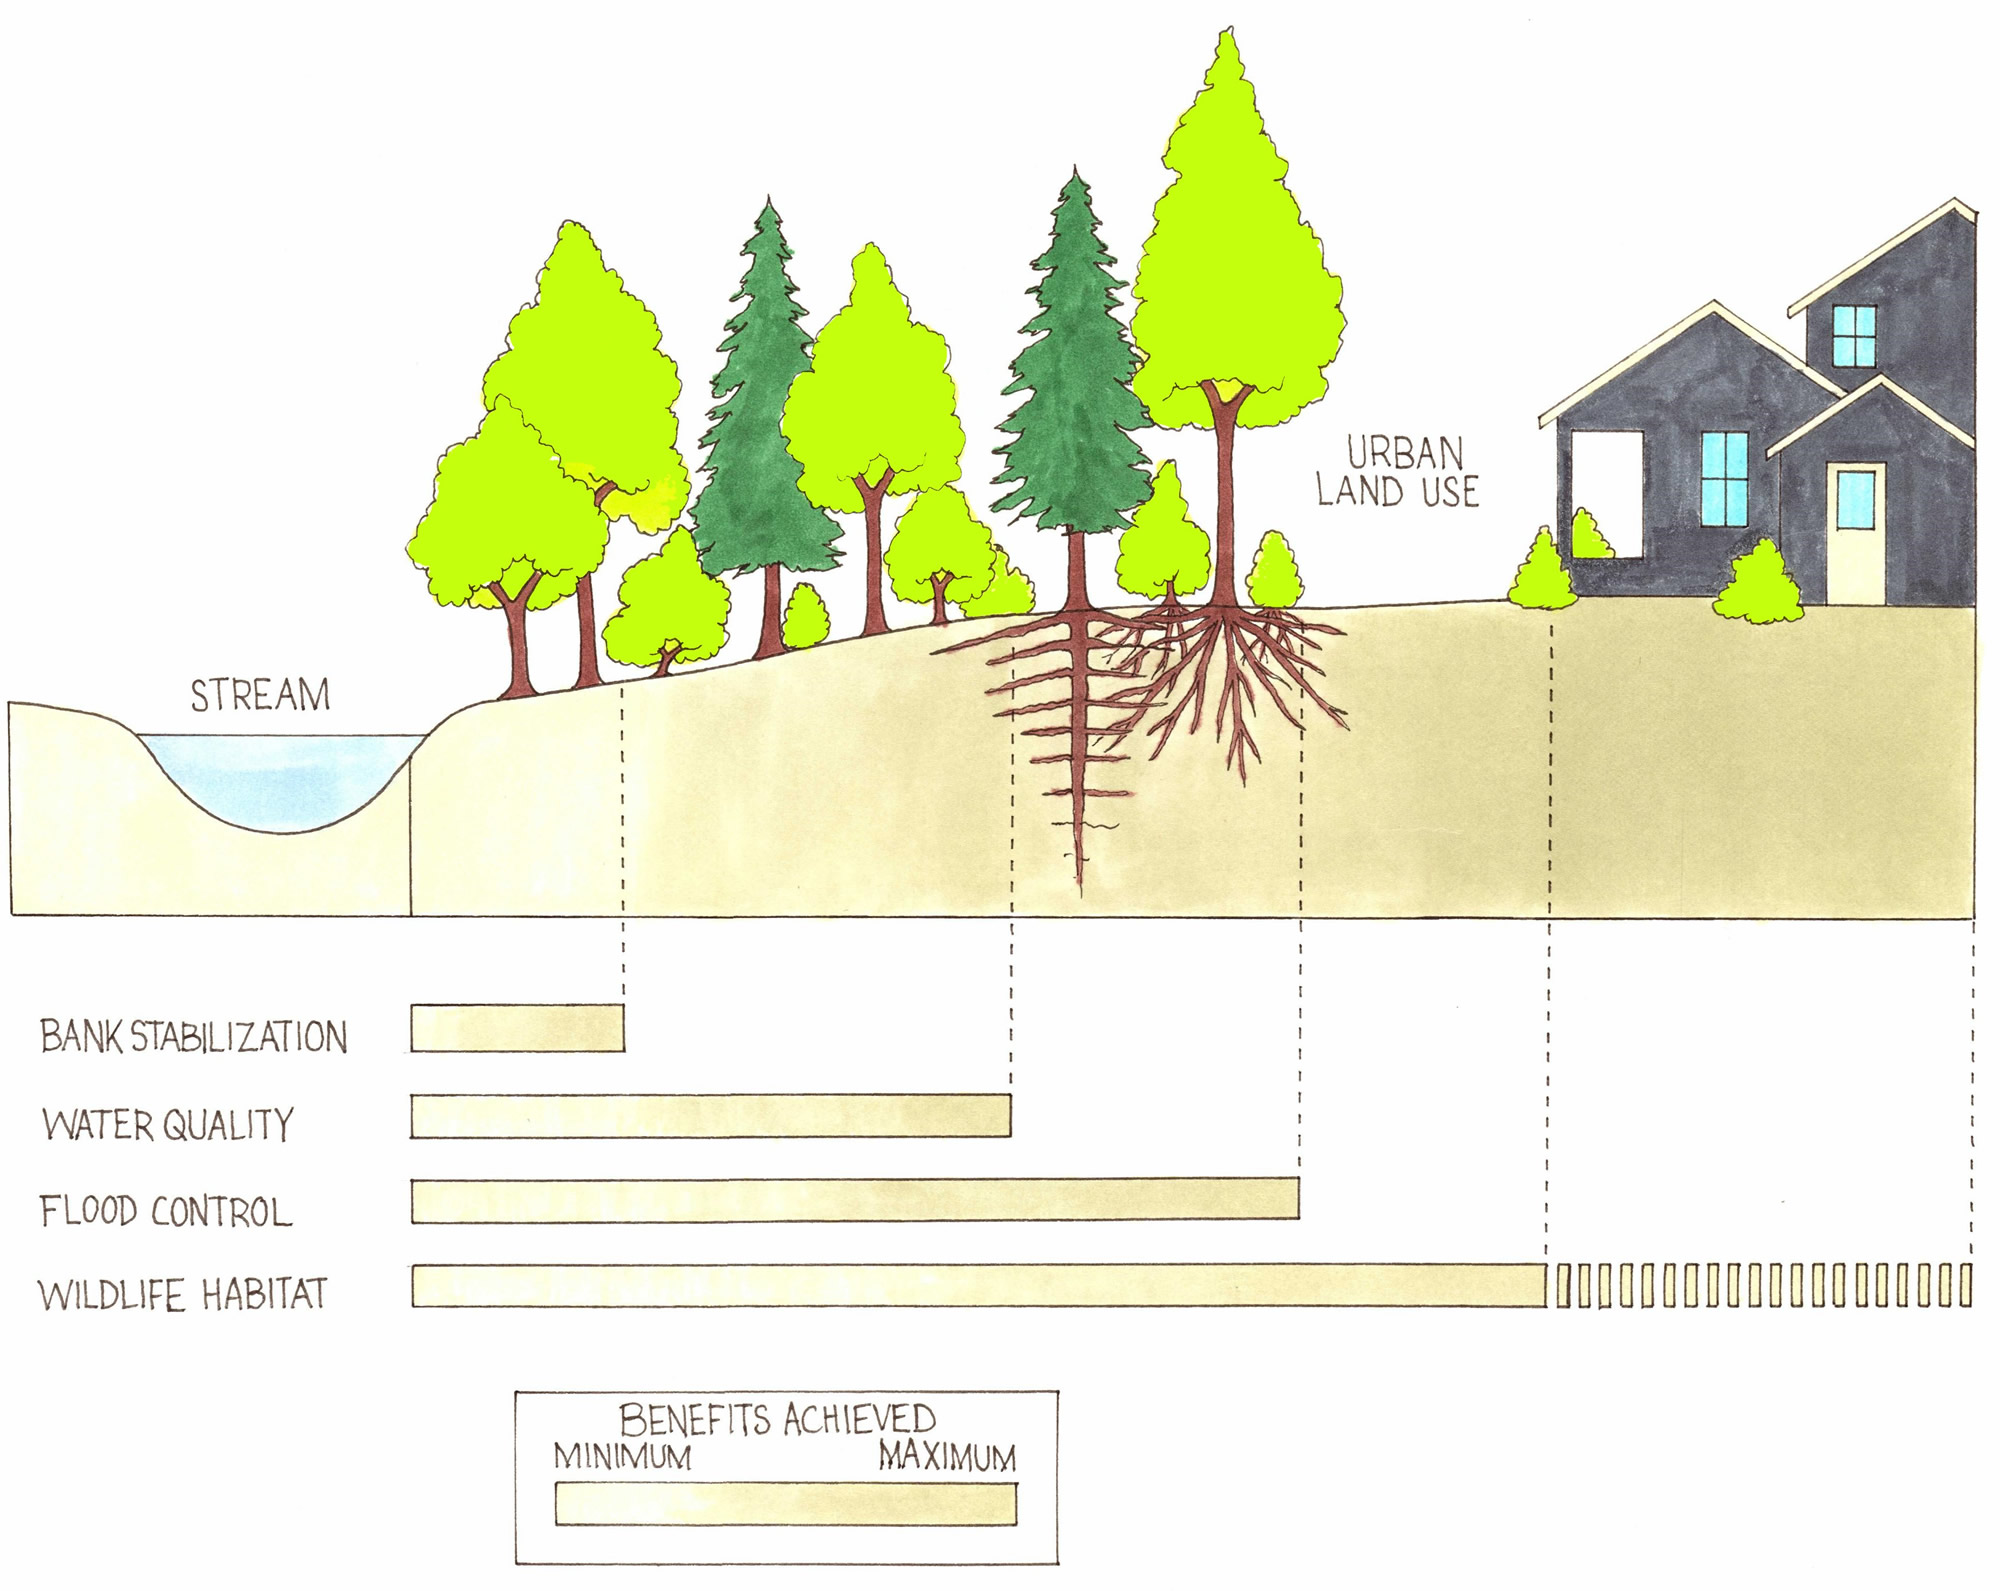
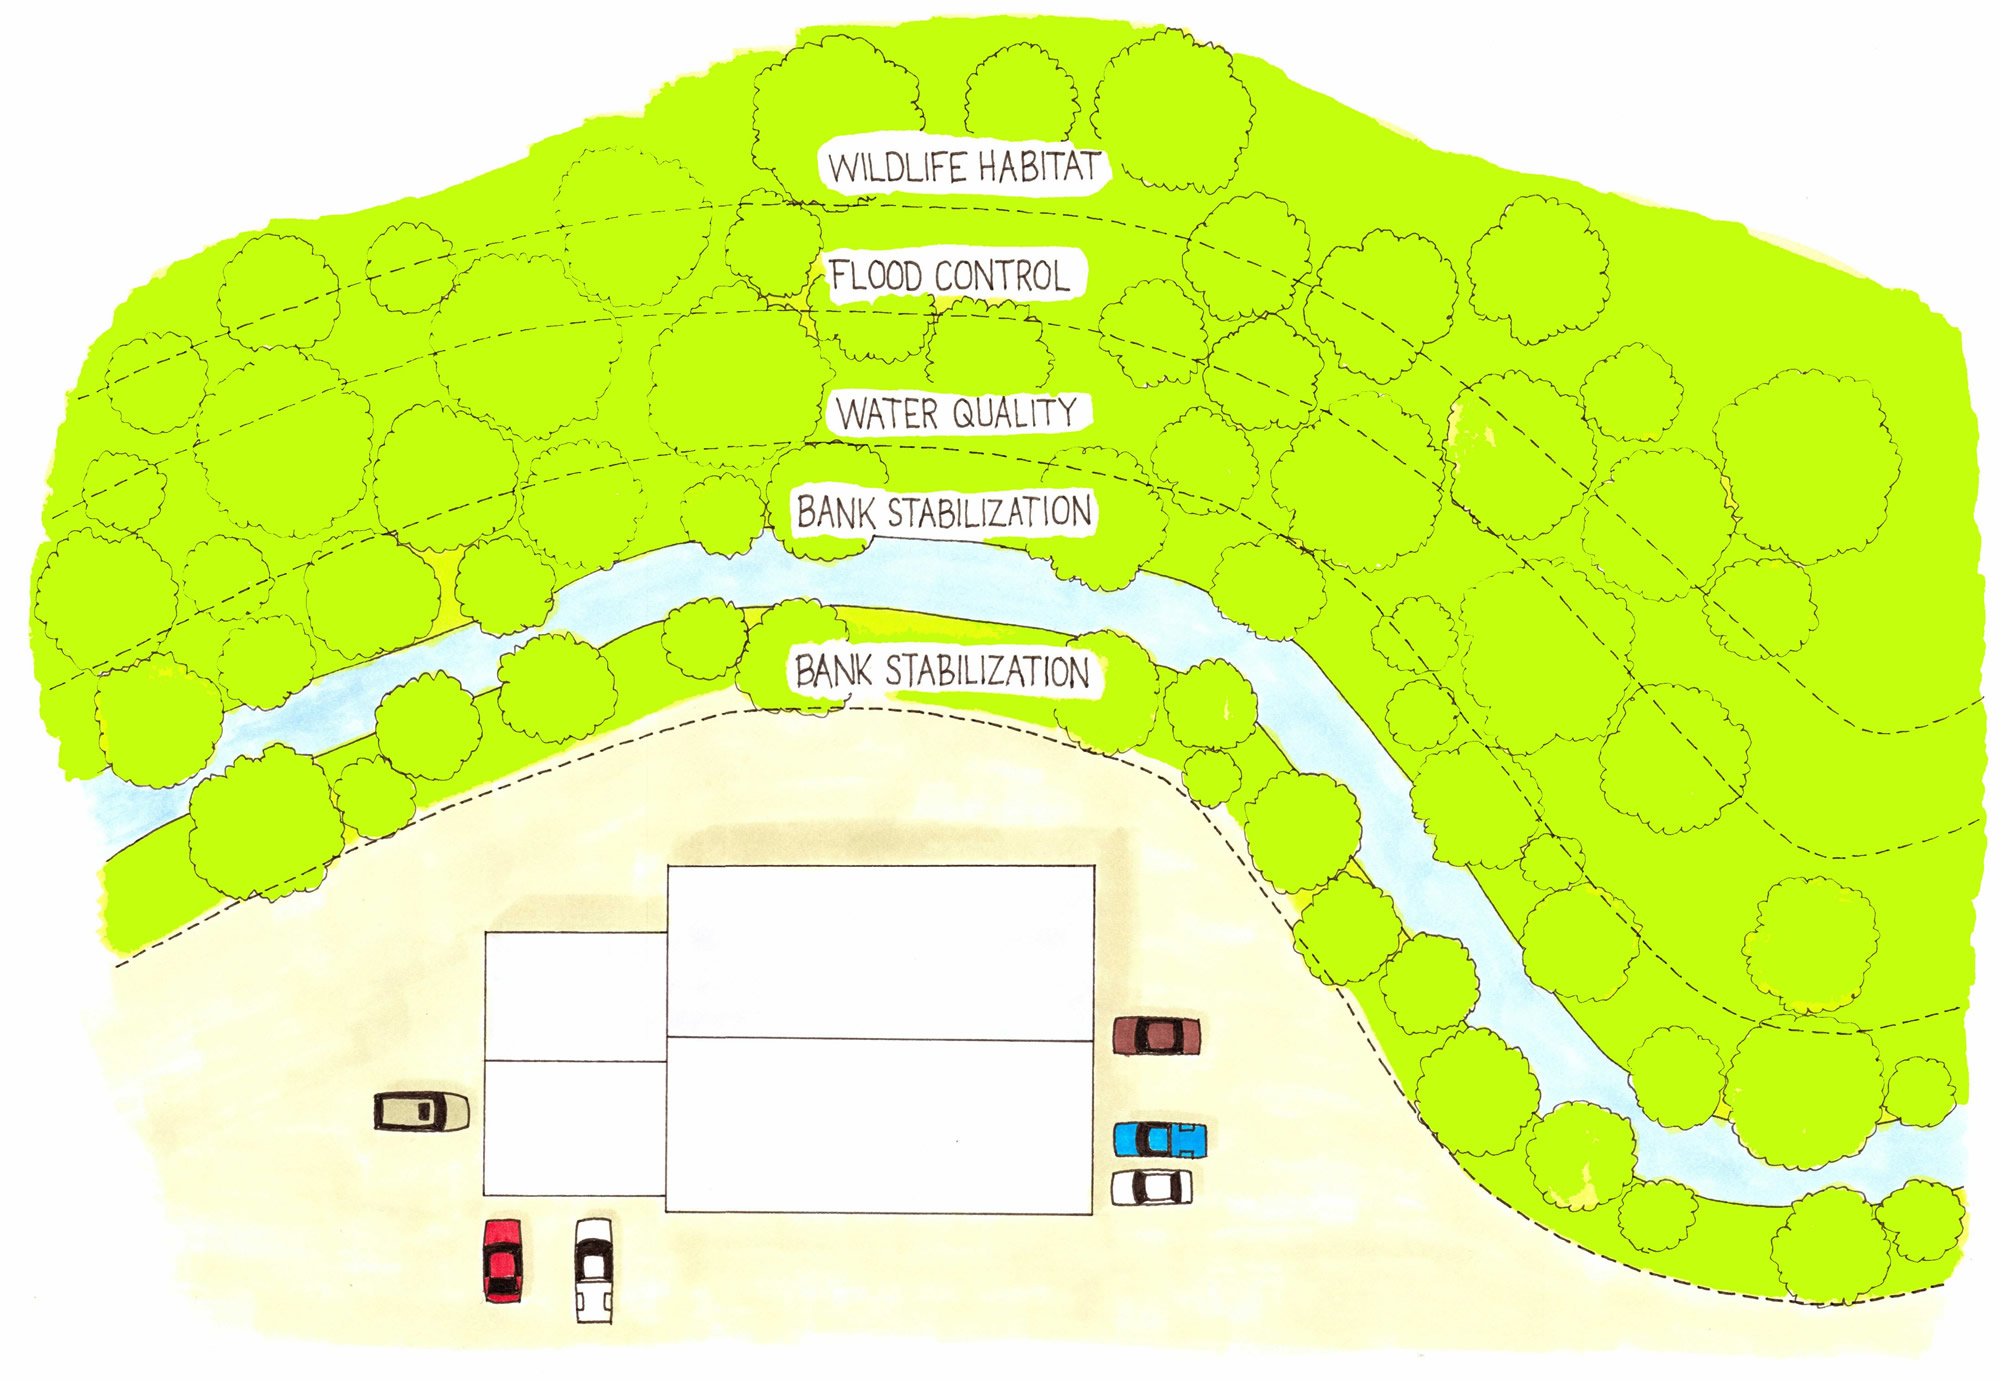
Figure 8: Riparian buffer benefits by width
Case Studies that Demonstrate the Cost of Doing Nothing
Protecting source water is often easier and more cost effective than treatment alone or dealing with the aftermath of contamination events.
Canadian examples:
- $65 million to deal with a PCB leak that contaminated a Niagara aquifer (Office of the Auditor General of Ontario, 2014).
- $64 million on the Walkerton tragedy (7 deaths, 2300 illnesses) that involved an overwhelmed water treatment plant (Drinking Water Review Panel, 2002).
B.C. example:
- $1 million to date on excessive nitrate from inadequate agricultural waste management affecting the Hullcar Aquifer, and remediation is ongoing (University of Victoria Environmental Law Center, 2016; ENV, 2018).
Okanagan examples:
- $4 million on cleanup of chemical warehouse fire with runoff into Mill Creek during firefighting efforts in 2011 (Kelowna Capital News, 2011).
- $450,000 and a $18,400 fine plus the permanent loss of the water supply after waste manure from a dairy farm was spread on frozen fields contaminated the Antwerp Springs well in Lavington, B.C.
- $150,000+ cleanup cost, which is more than 10 times the estimate to remove an abandoned house on the Mission Creek floodplain prior to its freshet wash-out.
Other Okanagan incidents where the economics have not been tallied:
- 2017 landslide, which affected Peachland water supply.
- Belgo Creek landslide in May 2017, which affected the Black Mountain Irrigation District water supply.
- Testalinden Creek dam failure in June 2010, which washed away multiple homes, blocked a provincial highway, and impacted both Osoyoos Lake and the drinking water intake used by the Town of Osoyoos.